What Is Glycemic Index and Glycemic Load? A Useful Number With Real Limits
The Short Answer
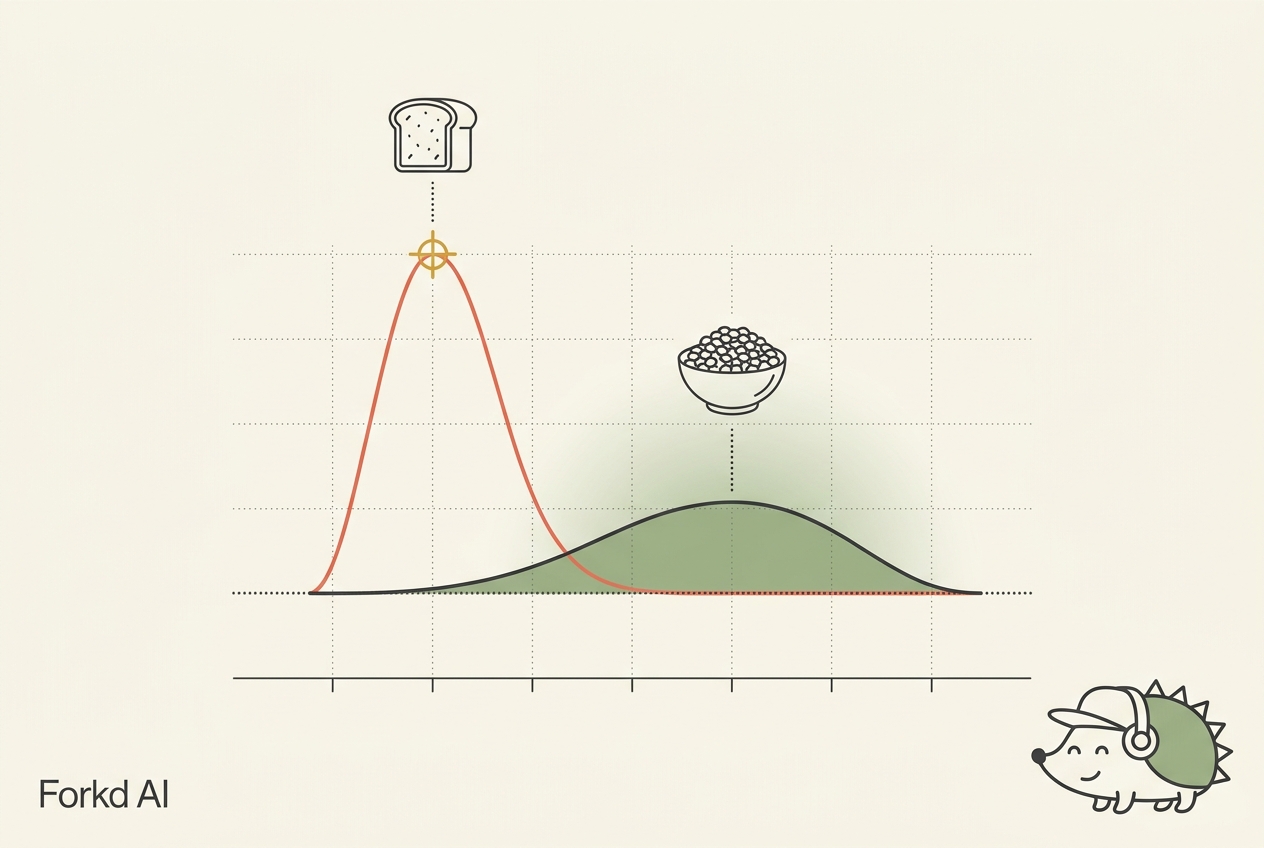
Glycemic index (GI) ranks how much a carbohydrate food raises blood sugar compared with pure glucose: 55 or less is low, 70 or more is high. Glycemic load (GL) multiplies GI by the carbs in a real portion, so it's more practical. Low-GI eating helps people with diabetes modestly, but individual responses vary widely.
Why Does Everyone Suddenly Care About Blood Sugar?
Blood sugar is having a moment. Healthy people wear glucose monitors, social feeds are full of spike charts, and "low GI" keeps showing up on packaging.
Glycemic index is the older, quieter idea underneath all of it. It's genuinely useful in some situations. It's also very easy to misuse, and the gap between the two is what this article is about.
What Is Glycemic Index?
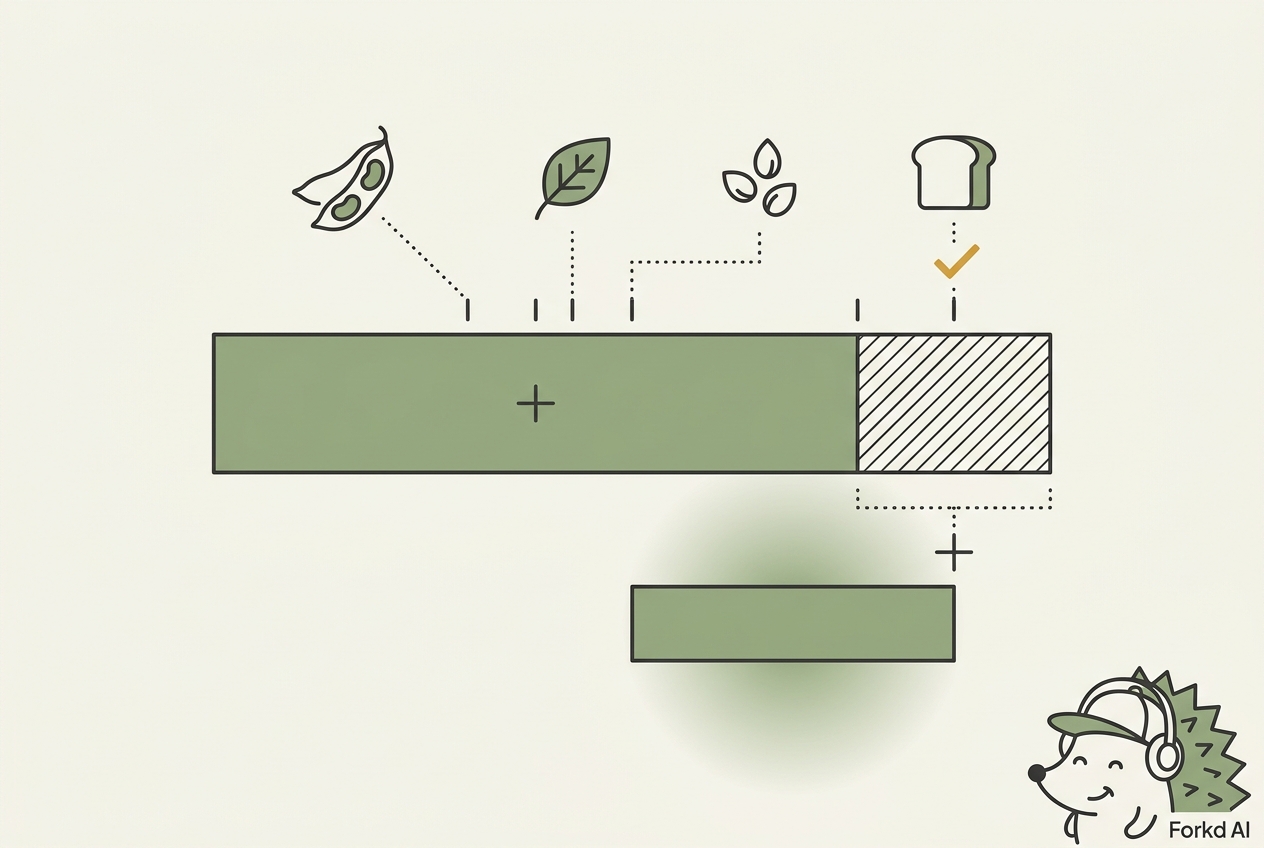
Glycemic index measures how much a food raises your blood sugar compared with pure glucose. To test a food, researchers give people a portion containing 50 grams of available carbohydrate, track their blood glucose, and compare the curve with the one produced by 50 grams of glucose. Glucose scores 100.
| GI category | Value |
|---|---|
| Low | 55 or less |
| Medium | 56 to 69 |
| High | 70 or more |
What Is Glycemic Load, and Why Is It More Useful?
GI has one big blind spot. It ignores portion size. It tells you how the carbs in a food behave, not how many of them you're eating.
Glycemic load fixes that:
Glycemic load = GI × grams of available carbohydrate in the portion ÷ 100
Available carbohydrate is total carbs minus fiber.
| GL category | Value |
|---|---|
| Low | 10 or less |
| Medium | 11 to 19 |
| High | 20 or more |
Watermelon is the classic example, and it's a little unfair to watermelon. Its GI is 76, which is high. A cup of diced watermelon has only about 11 grams of available carbs, though, so its glycemic load is a low 8. You'd have to eat a lot of it to get a big blood sugar response.
What Are the GI and GL Values of Common Foods?
The GI values below are averages from the 2008 International Tables of Glycemic Index and Glycemic Load, which pooled results from multiple labs. We calculated glycemic load for each portion using USDA FoodData Central carbohydrate and fiber values.
Which grains, breads, and cereals have the highest GI?
| Food | GI | Portion | GL |
|---|---|---|---|
| Cornflakes | 81 | 1 cup (28 g) | 19 |
| White bread | 75 | 1 slice (29 g) | 10 |
| Whole wheat bread | 74 | 1 slice (32 g) | 9 |
| White rice, boiled | 73 | 1 cup (158 g) | 32 |
| Brown rice, boiled | 68 | 1 cup (202 g) | 33 |
| Porridge, rolled oats | 55 | 1 cup cooked (234 g) | 13 |
| Spaghetti, white | 49 | 1 cup (124 g) | 18 |
Two results tend to annoy people. Whole wheat bread scores 74, basically the same as white bread at 75. And brown rice, at 68, is only slightly lower than white rice. USDA's cup of cooked brown rice is also heavier, so per cup its glycemic load comes out about the same. Brown rice still wins on fiber and nutrients. It just doesn't win much on blood sugar.
Pasta lands lower than most people expect.
How do potatoes and vegetables compare?
| Food | GI | Portion | GL |
|---|---|---|---|
| Potato, boiled | 78 | 1 medium (167 g) | 24 |
| Sweet potato, boiled | 63 | 1 medium (151 g) | 14 |
| Carrots, boiled | 39 | 1/2 cup (78 g) | 2 |
Rice and potatoes carry the heaviest glycemic loads in this article. Carrots, which get accused of being "too sugary" surprisingly often, have a glycemic load of 2.
Which legumes have the lowest GI?
| Food | GI | Portion | GL |
|---|---|---|---|
| Kidney beans, boiled | 24 | 1 cup (177 g) | 7 |
| Chickpeas, boiled | 28 | 1 cup (164 g) | 9 |
| Lentils, boiled | 32 | 1 cup (198 g) | 8 |
Beans are the quiet winners. A full cup of lentils has a lower glycemic load than one slice of white bread. Beans are also a solid protein source; see protein in black beans.
What is the GI of common fruits?
| Food | GI | Portion | GL |
|---|---|---|---|
| Watermelon | 76 | 1 cup diced (152 g) | 8 |
| Pineapple | 59 | 1 cup chunks (165 g) | 11 |
| Banana | 51 | 1 medium (118 g) | 12 |
| Mango | 51 | 1 cup (165 g) | 11 |
| Orange | 43 | 1 fruit (131 g) | 5 |
| Dates | 42 | 1 Medjool date (24 g) | 7 |
| Apple | 36 | 1 medium (182 g) | 7 |
Most whole fruit sits in low-to-medium territory. Dates are the one to watch. Each one carries a glycemic load of 7, and nobody eats one date. Our pages on carbs in a banana and carbs in an apple have the full carb numbers.
What about sugars and snacks?
| Food | GI |
|---|---|
| Rice crackers | 87 |
| Popcorn | 65 |
| Sucrose (table sugar) | 65 |
| Honey | 61 |
| Soft drink | 59 |
| Chocolate | 40 |
| Fructose | 15 |
Three cups of air-popped popcorn work out to a glycemic load of about 10.
What Can't Glycemic Index Tell You?
Mayo Clinic summed up the tension nicely:
The glycemic index (GI) measures how different foods impact blood sugar levels. While it can be a useful tool—especially for people with diabetes—it has its limits.
— Mayo Clinic (@MayoClinic) March 29, 2025
GI can help guide food choices. Learn more from Mayo Clinic experts. https://t.co/tzYjACAgi5 pic.twitter.com/Ygyw3t817B
Here are those limits.
GI says nothing about nutrition. Chocolate has a GI of 40. Watermelon's is 76. Pure fructose scores 15. Judged on GI alone, a chocolate bar beats fruit, which is plainly absurd. The authors of the 2008 tables made the same point: many sweets have a low GI, but their saturated fat undercuts their nutritional value.
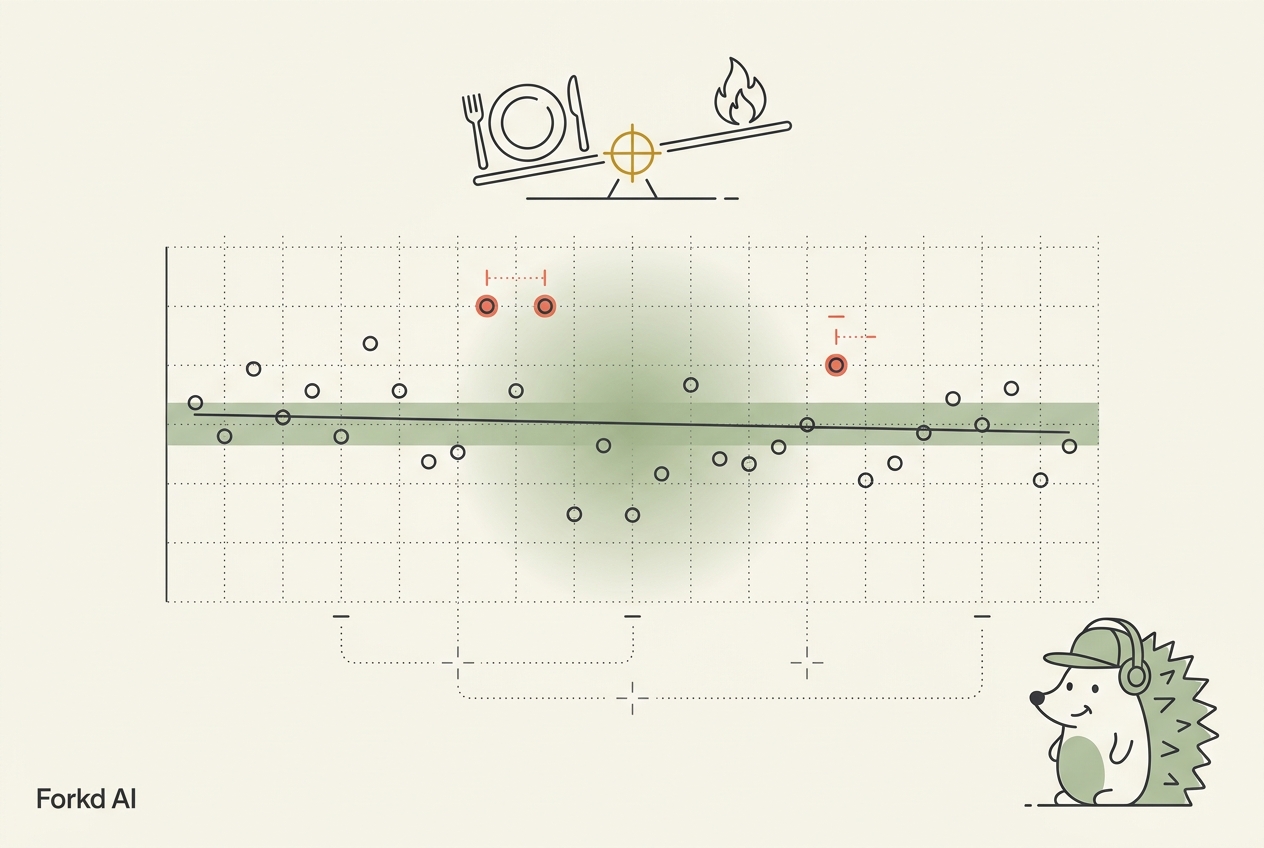
GI varies between people, and within the same person. A 2016 Tufts study tested white bread in 63 healthy adults, three times each, using standardized methods. The average GI came out at 62, well below the 75 in the tables. A person's own results varied by 20 percent from one test to the next, and results varied by 25 percent between people. In a larger Israeli study, researchers tracked glucose in 800 people across 46,898 meals and found high variability in responses to identical meals.
GI is measured on single foods. Real meals combine carbs with protein, fat, and fiber, which changes the response. Ripeness, cooking, and processing shift the numbers too. The 2021 update of the international tables found that breads, breakfast cereals, and rice each come in high, medium, and low GI versions.
Does a Low-GI Diet Actually Help?
That depends a lot on who you are.
For people with diabetes, yes, modestly. A 2021 BMJ meta-analysis of 29 trial comparisons in 1,617 people with type 1 or type 2 diabetes found that low-GI or low-GL diets lowered HbA1c by 0.31 percentage points compared with higher-GI diets. The certainty of that finding was rated high. These diets also improved fasting glucose, LDL cholesterol, body weight, and several other markers. If you manage diabetes, our roundup of nutrition apps for type 2 diabetes is a good next step.
For everyone else, the evidence is thin. The 2019 Lancet meta-analyses on carbohydrate quality found smaller or no risk reductions for low-GI or low-GL diets, and rated that evidence low to very low certainty. Fiber and whole grains came out far more protective.
The OmniCarb trial is even more deflating. Researchers fed 163 overweight adults fully controlled diets for five weeks at a time. Within a high-carb diet, switching to low-GI carbs didn't improve insulin sensitivity, blood pressure, or cholesterol. Insulin sensitivity actually fell 20 percent, and LDL cholesterol rose 6 percent.
Treat GI as a tiebreaker, especially if you have diabetes. It's a poor substitute for the basics: fiber, whole foods, and total calories.
How Should You Use Glycemic Index Day to Day?
- Think in glycemic load. Portion size changes the picture more than the ranking does.
- Swap within a meal. Rolled oats for cornflakes, or beans in place of some of the rice.
- Build mixed plates. Eat carbs with protein, fat, and fiber instead of on their own.
- Lean on fiber. High-fiber foods like legumes tend to land low on glycemic load, and fiber has much stronger evidence behind it. See foods high in fiber and net carbs vs total carbs.
- If you wear a glucose monitor, trust your own data. Responses vary so much that your readings beat any table.
Glycemic load needs two numbers, and a GI table only gives you one. Forkd's macro tracker logs total carbs, fiber, and net carbs per ingredient from a photo, a voice note, or a line of text, so you can see how many carbs are actually on your plate. Search the App Store for "AI Calorie Tracker: Forkd".
Frequently Asked Questions
What is a good glycemic index number?
A GI of 55 or less is low, 56 to 69 is medium, and 70 or more is high. For real portions, glycemic load is more useful: 10 or less is low, 11 to 19 is medium, and 20 or more is high.
Is glycemic load better than glycemic index?
For everyday eating, yes. Glycemic index only ranks how a food's carbs affect blood sugar. Glycemic load also accounts for how many carbs are in the portion you eat, which is why watermelon, with a GI of 76, has a low glycemic load of 8 per cup.
Are low-GI foods good for weight loss?
Not on their own. A 2021 meta-analysis found low-GI diets reduced body weight in people with diabetes, but for the general population, the evidence that low-GI eating protects health is weak. Total calories, protein, and fiber matter more for weight loss.
Does brown rice have a lower glycemic index than white rice?
Slightly. In the international tables, boiled brown rice averages 68 and boiled white rice averages 73. Rice varieties differ a lot, so choose brown rice for its fiber and nutrients rather than for blood sugar alone.
Why does the same food give me different blood sugar readings?
Glycemic responses vary with the person, the meal, and the day. In one study, the same people tested white bread three times, and their individual GI results varied by 20 percent. What else you eat with the food and how much of it you eat also change the response.
Key Takeaways
- Glycemic index ranks how much a carb food raises blood sugar versus glucose: 55 or less is low, 70 or more is high.
- Glycemic load multiplies GI by the available carbs in a portion: 10 or less is low, 20 or more is high.
- Legumes stay low even in big portions. A cup of lentils (GL 8) beats a single slice of white bread (GL 10).
- Low-GI diets modestly improve HbA1c in people with diabetes, but evidence for the general population is low certainty.
- Individual responses vary widely, so use GI as a tiebreaker, not a diet rule.
References
- Atkinson FS, Foster-Powell K, Brand-Miller JC. (2008). International tables of glycemic index and glycemic load values: 2008. Diabetes Care. pmc.ncbi.nlm.nih.gov
- Atkinson FS, Brand-Miller JC, Foster-Powell K, Buyken AE, Goletzke J. (2021). International tables of glycemic index and glycemic load values 2021: a systematic review. American Journal of Clinical Nutrition, 114(5), 1625-1632. doi.org
- Chiavaroli L, et al. (2021). Effect of low glycaemic index or load dietary patterns on glycaemic control and cardiometabolic risk factors in diabetes: systematic review and meta-analysis of randomised controlled trials. BMJ, 374, n1651. doi.org
- Reynolds A, Mann J, Cummings J, Winter N, Mete E, Te Morenga L. (2019). Carbohydrate quality and human health: a series of systematic reviews and meta-analyses. The Lancet, 393(10170), 434-445. pubmed.ncbi.nlm.nih.gov
- Sacks FM, Carey VJ, Anderson CA, et al. (2014). Effects of high vs low glycemic index of dietary carbohydrate on cardiovascular disease risk factors and insulin sensitivity: the OmniCarb randomized clinical trial. JAMA, 312(23), 2531-2541. doi.org
- Matthan NR, Ausman LM, Meng H, Tighiouart H, Lichtenstein AH. (2016). Estimating the reliability of glycemic index values and potential sources of methodological and biological variability. American Journal of Clinical Nutrition, 104(4), 1004-1013. doi.org
- Zeevi D, Korem T, Zmora N, et al. (2015). Personalized nutrition by prediction of glycemic responses. Cell, 163(5), 1079-1094. doi.org
- University of Georgia Cooperative Extension. Glycemic Index and Glycemic Load (C1323-03). GI and GL category cutoffs. fieldreport.caes.uga.edu
- USDA FoodData Central. Carbohydrate and fiber values for cornflakes (174648), white bread (174924), whole-wheat bread (172688), white rice (168878), brown rice (169704), oatmeal (173905), spaghetti (169737), boiled potato (170440), boiled sweet potato (168484), carrots (170394), kidney beans (175194), chickpeas (173757), lentils (172421), watermelon (167765), pineapple (169124), banana (173944), mango (169910), orange (169097), Medjool dates (168191), apple (171688), and air-popped popcorn (167959). fdc.nal.usda.gov
Written by
Vineet Karhail builds Forkd, the AI-powered calorie and nutrition tracking app, and writes its research-backed guides on calories, macros, and micronutrients.